Depth map images represent the Z (or distance from camera) as brightness or color.
Depth map image created from a laser scan of almonds.
But you can't tell where the box, or its side walls are. It is more difficult to tell where the corners and flaps are.
The interesting information for humans (and eventually robots) if to color the image based on the surface, not on the depth.
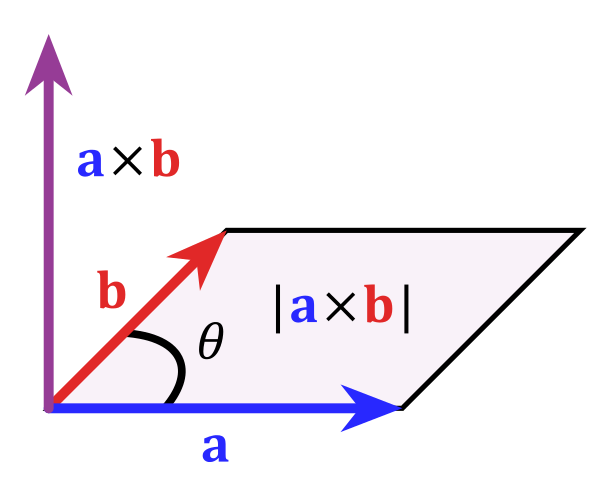
a x b = normal vector (?does that make it an abnormal vector? dumb joke)
The normal vector is 3 dimensional. There is a convenient way of displaying 3D data by associating the 3D x,y,z to the colors red, green, blue. This effectively moves the normal vector into the RGB color space. That is super great because there are many color image machine vision tools!!!
But the RGB color space is NOT how humans think about the world!
Artists use a hue, saturation and intensity color space. The color wheel is a common way for humans to think of red, green and blue.
 |
| Color wheel. Hue revolves around the circumference. Intensity increases toward the center. |
The normal vector traces out a sphere with radius 1.
So now look at the color wheel again, but think that you are looking down onto a color sphere
Lets apply this idea to a depth image of a pallet of paper bags.
 |
| Depth image, bright pixels are further from camera. |
How can you tell the orientation of the stacks of bag bundles on the pallet in the center of the depth image?
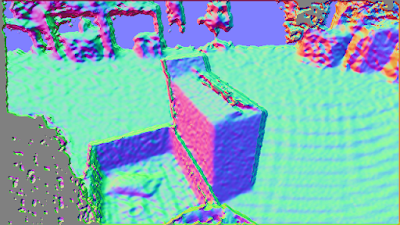
Convert the surface normal to an HSL color sphere like this...
From the HSL normal image you can tell where the walls of the bundles are. You can hopefully see that the bundle in the center is falling off. It is tilted up and right, giving it a pink or magenta color.
You may even notice that a bundle has fallen onto the ground (The green cyan blob in the image above the pallet.) It is not noticeable in the depth image.
By coloring the surfaces using a HSL or HSI model, the walls of objects become easy to detect. For a robot, the orientation or approach angle is part of the color image.
 |
| HSI encoded normals image. White pixels are perpendicular to the camera. Color (hue) encodes rotation of each surface. |
Thanks for reading my blog - Lowell Cady


.svg/480px-Sphere_(parameters_r%2C_d).svg.png)


No comments:
Post a Comment